InstaRecap Analytics
The InstaRecap analytics dashboard helps you measure how attendees engage with session recaps — transcription coverage, user adoption, content consumption, and social sharing.
Access Analytics
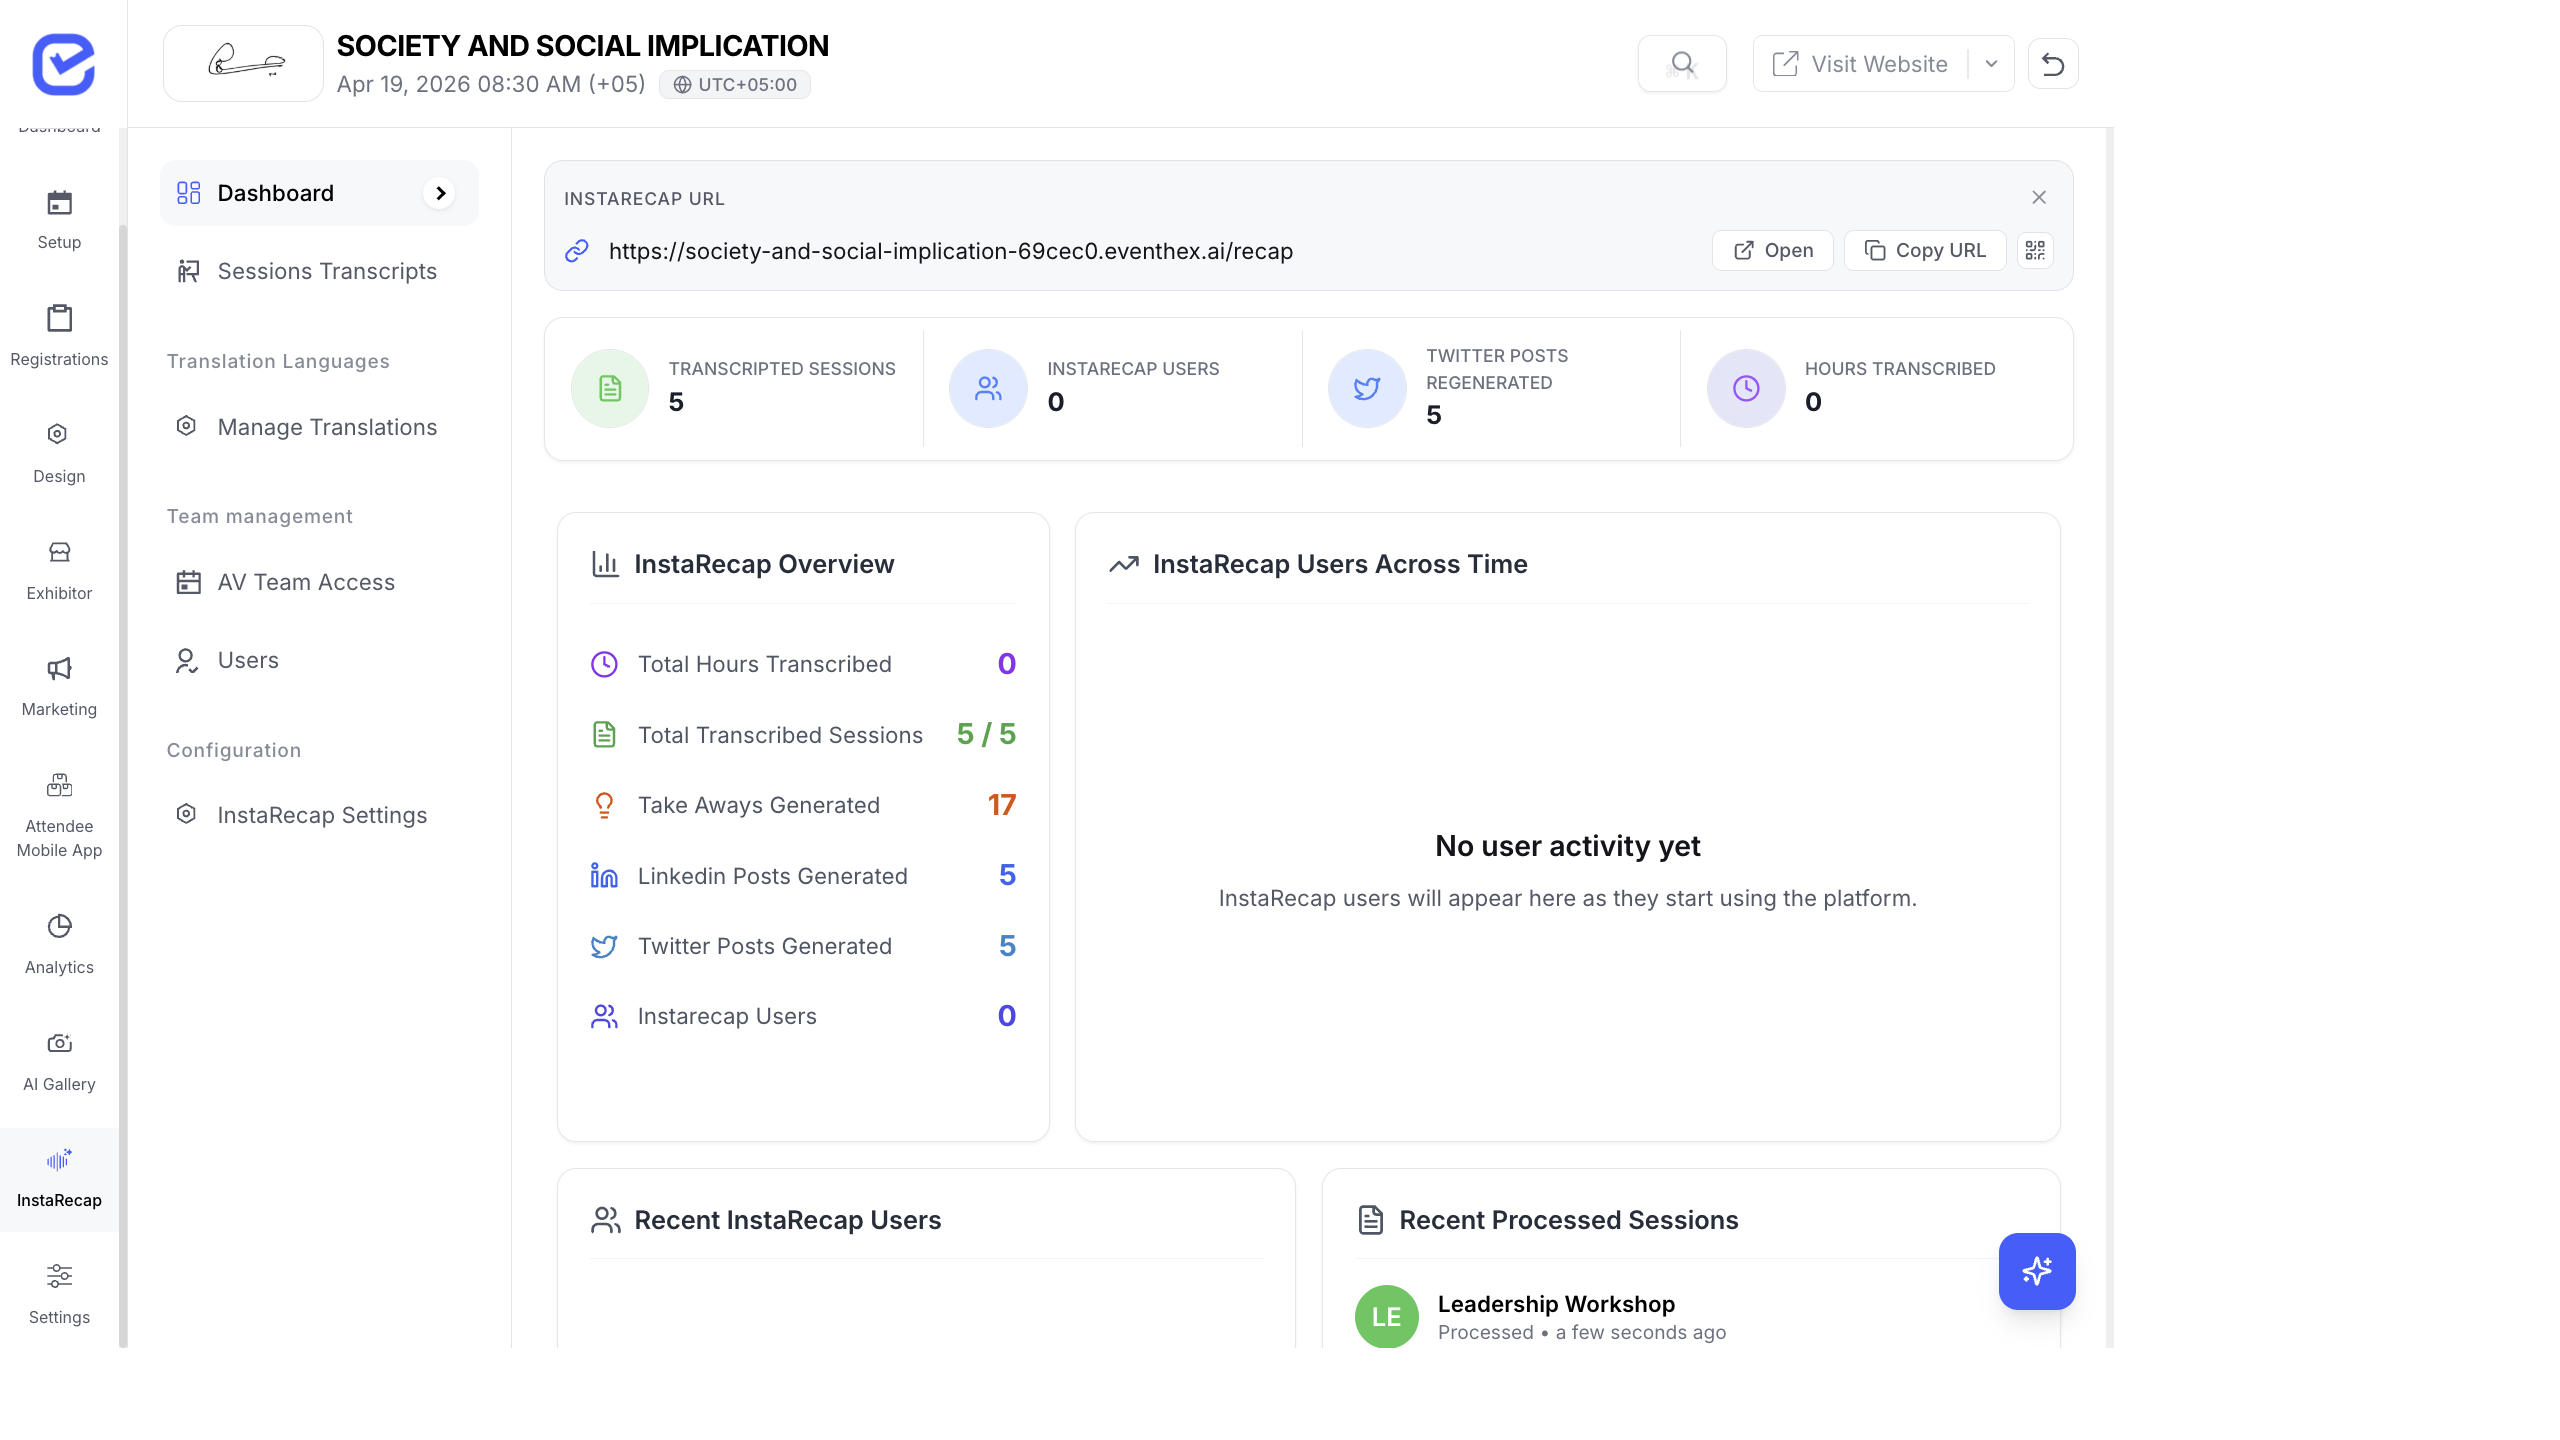
Section titled “Access Analytics”Go to InstaRecap → Dashboard.
The dashboard provides both summary KPIs and detailed analytics views.
KPI Cards
Section titled “KPI Cards”| Metric | What It Shows | Why It Matters |
|---|---|---|
| Transcribed Sessions | Sessions with completed transcripts (shown as X / Y total) | Transcription coverage — are all sessions processed? |
| InstaRecap Users | Attendees who accessed recaps | User adoption — how many people are using the feature |
| Generated Twitter Posts | AI-generated social posts | Content creation — social amplification potential |
| Hours Transcribed | Total audio hours processed | Processing volume |
Detailed Analytics
Section titled “Detailed Analytics”When viewing the full analytics, additional metrics appear:
| Metric | Description |
|---|---|
| Total Hours | Total audio duration processed |
| Total Transcribed Sessions | Completed transcripts vs. total sessions |
| Total Regenerated Takeaways | Key takeaways that were regenerated for quality |
| Total Generated LinkedIn Posts | AI-generated professional social posts |
| Total Generated Twitter Posts | AI-generated short-form social posts |
| InstaRecap Users | Unique attendees who accessed the feature |
Dashboard Charts
Section titled “Dashboard Charts”Users Across Time
Section titled “Users Across Time”A line chart showing InstaRecap user activity over time. Useful for:
- Identifying peak engagement periods (usually 1–3 days post-event)
- Measuring the impact of email/WhatsApp campaigns promoting recaps
- Comparing engagement across event days
Content Breakdown
Section titled “Content Breakdown”A pie chart showing the distribution of:
- InstaRecap users
- Transcribed sessions
- Key takeaways generated
- Hours transcribed
This gives you a quick visual balance of content volume vs. consumption.
Recent Sessions
Section titled “Recent Sessions”A live feed of recently processed sessions showing:
- Session title
- Processing status
- Last update timestamp
Recent Users
Section titled “Recent Users”A list of the latest attendees who accessed InstaRecap:
- User name with initials avatar
- “Last Logged In” with relative timestamps (e.g., “2 hours ago”)
Key Metrics to Monitor
Section titled “Key Metrics to Monitor”| Metric | Target | Action If Low |
|---|---|---|
| Transcription Coverage | 100% of recorded sessions | Check for failed uploads; re-upload and process |
| User Adoption | > 30% of attendees | Send reminder campaigns with direct links to recaps |
| Content Quality | Spot-check summaries | Regenerate takeaways for key sessions if AI output is weak |
| Post-Event Spike | Activity within 48 hours | Time your recap announcement email for maximum impact |
Best Practices
Section titled “Best Practices”- Check coverage daily — during multi-day events, verify that each day’s sessions are fully transcribed before the next day starts.
- Promote immediately — send a campaign within 2 hours of processing completion. Engagement drops sharply after 48 hours.
- Highlight key sessions — in your campaign, link directly to keynote and high-profile session recaps rather than the generic recaps page.
- Track the funnel — users who read recaps are highly engaged. Consider targeting them for future event promotions.
- Compare across events — track InstaRecap adoption rate (users / total attendees) across events to measure feature awareness growth.