AI Gallery Analytics
The AI Gallery analytics dashboard gives you detailed insights into how attendees interact with your event photos — from upload through face recognition to download and social sharing.
Access Analytics
Section titled “Access Analytics”Go to AI Gallery → Dashboard.
All analytics are displayed on the dashboard with KPI cards at the top and detailed charts below.
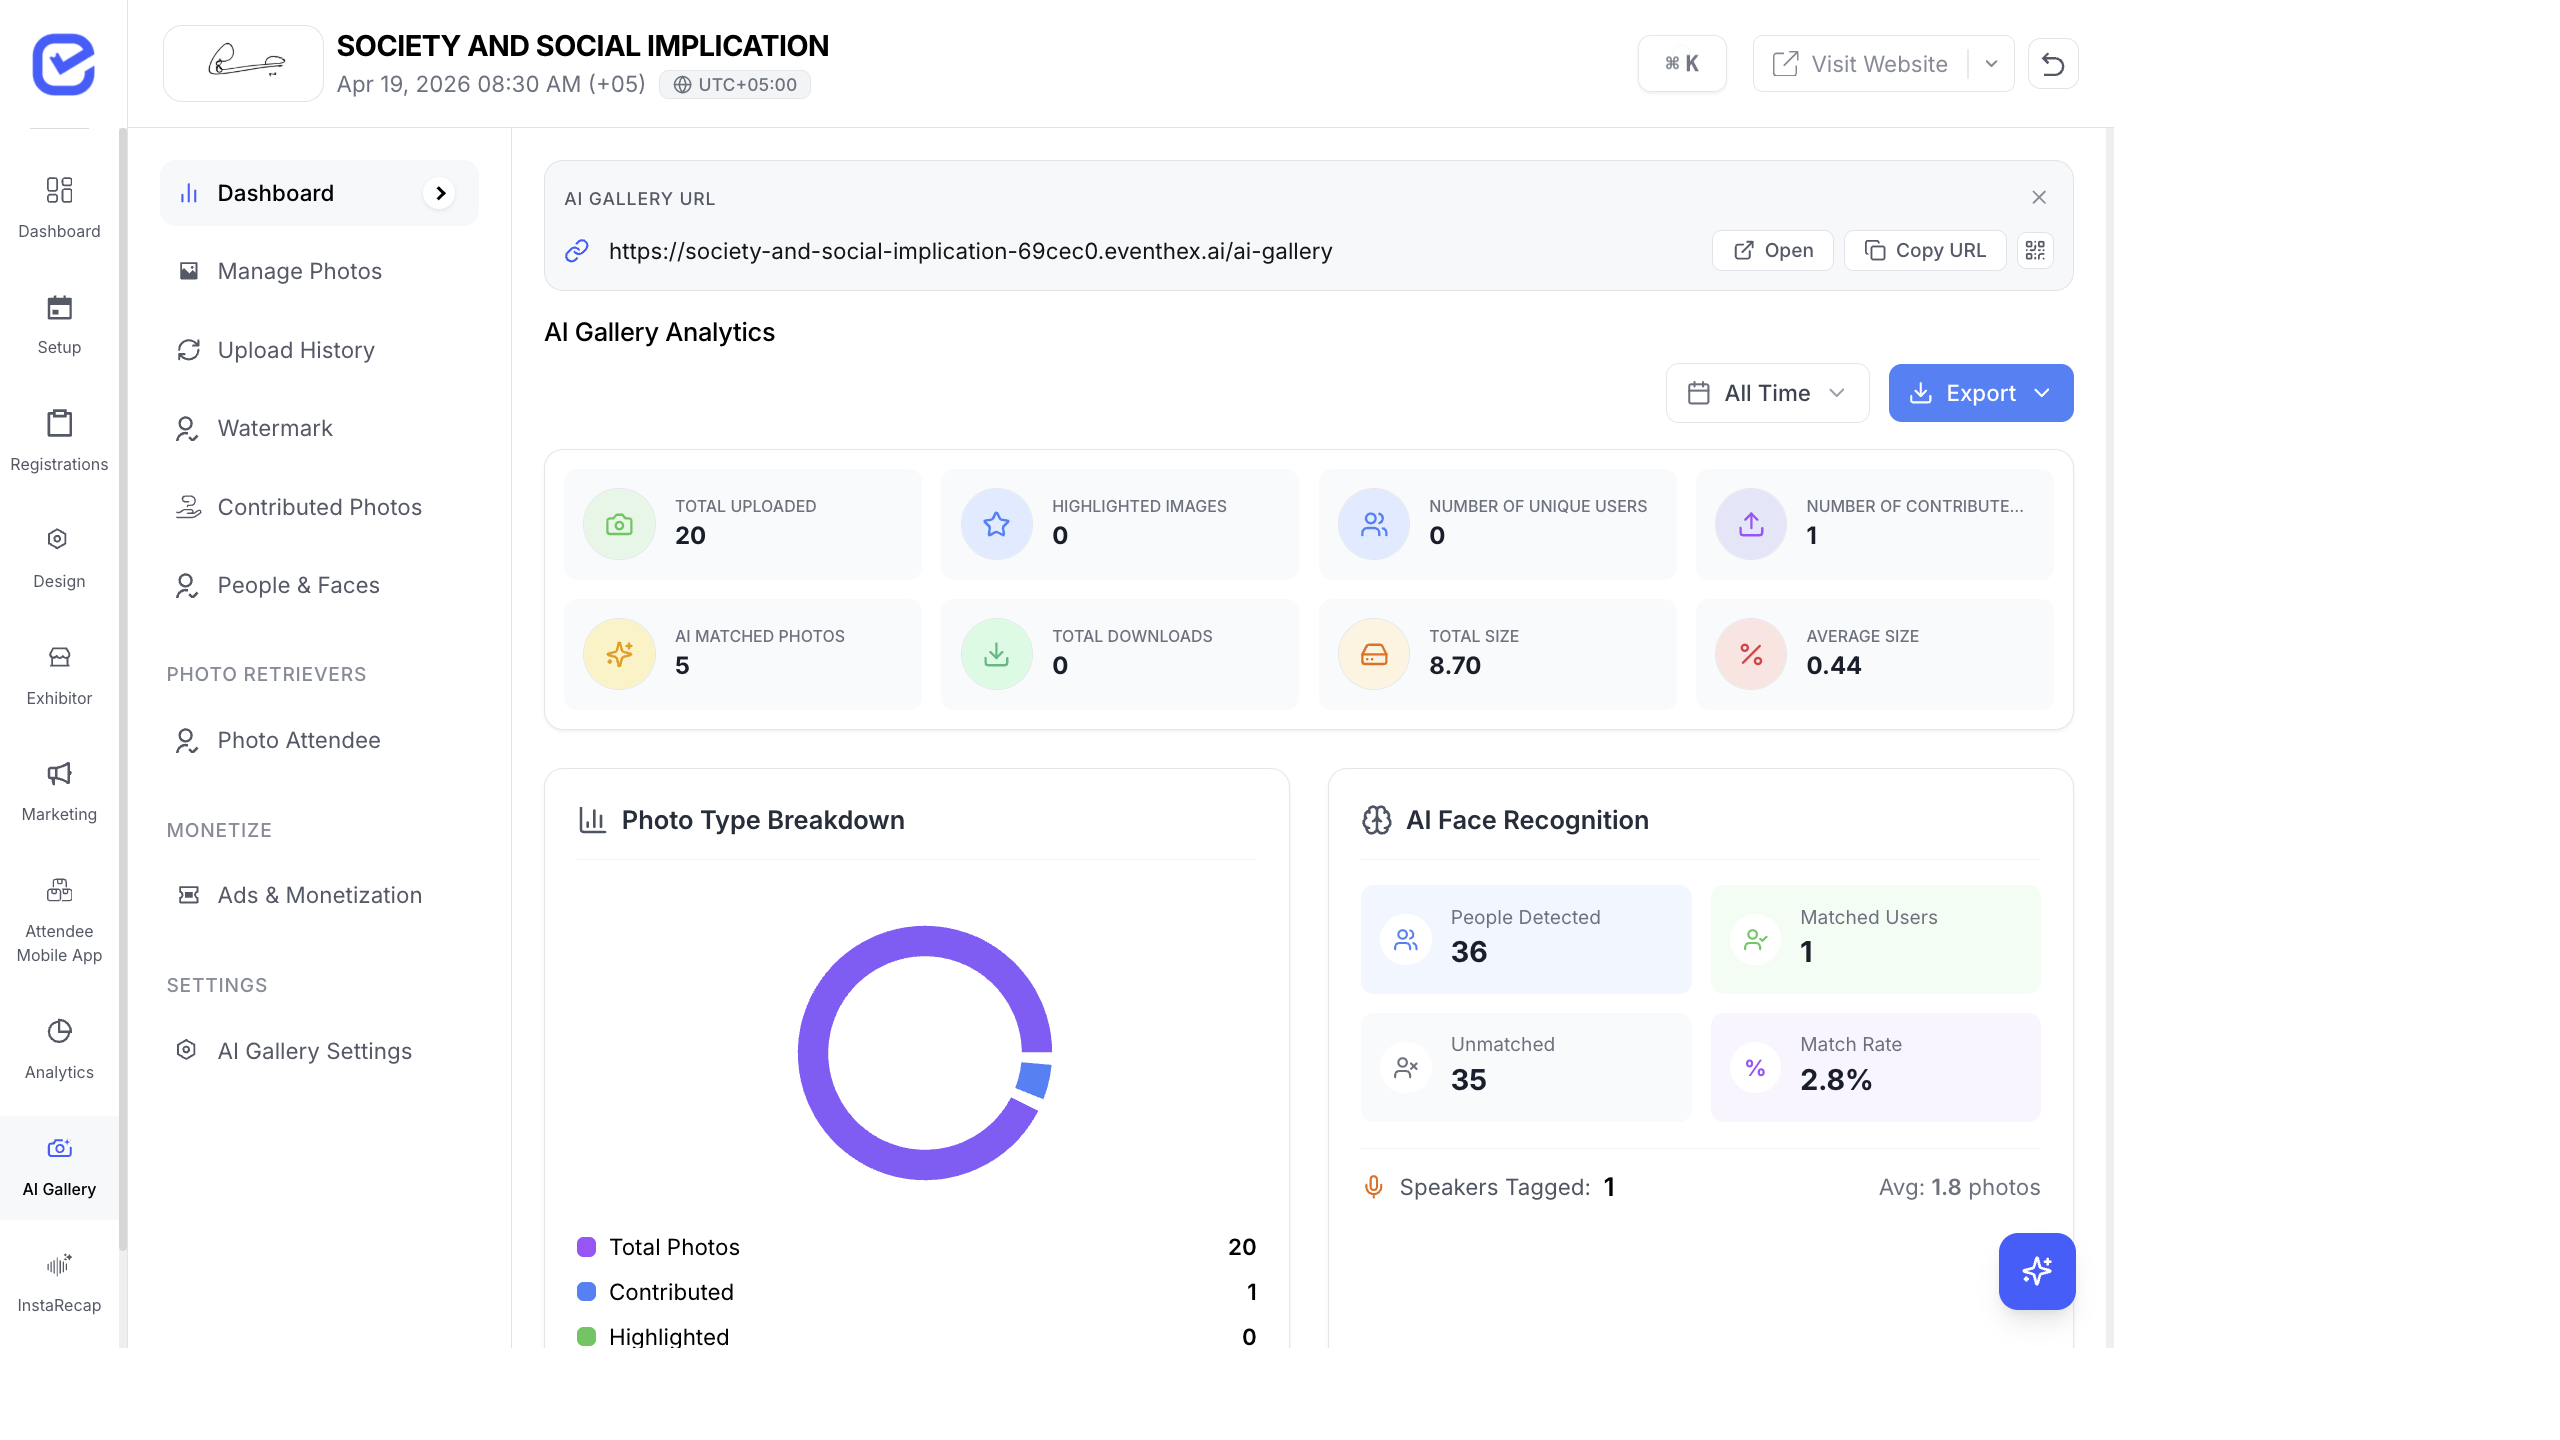
KPI Cards
Section titled “KPI Cards”The top row shows real-time summary metrics:
| Card | What It Shows | Why It Matters |
|---|---|---|
| Total Uploaded | Number of photos in the gallery | Gallery size and coverage |
| Total Size | Storage consumed | Infrastructure planning |
| Unique Users | People detected by face recognition | Event reach — how many attendees have photos |
| Highlighted | Starred/featured photos | Curated content for social promotion |
| Contributed | Attendee-uploaded photos | Community engagement level |
| Downloads | Total photo downloads | How many photos attendees saved |
| Social Shares | Photos shared to social media | Organic reach and marketing value |
Dashboard Charts
Section titled “Dashboard Charts”Photo Breakdown
Section titled “Photo Breakdown”A pie or bar chart showing the split between:
- Organizer Photos — uploaded by the event team
- Community Contributions — uploaded by attendees
This tells you how much your attendees contributed to the gallery content.
Download Timing
Section titled “Download Timing”A timeline chart showing when downloads happen:
- During the event — attendees sharing live
- Same day after — immediate post-event engagement
- Next few days — delayed engagement
- Week later — long-tail engagement
This helps you time your follow-up campaigns — send a reminder email when download activity starts dropping.
Face Recognition Performance
Section titled “Face Recognition Performance”| Metric | Description |
|---|---|
| Total Face Groups | Unique people detected |
| Matched Groups | People who have retrieved their photos |
| Unmatched Groups | People detected but haven’t retrieved yet |
| Total Faces Detected | Individual face detections across all photos |
| Average Photos Per Person | Mean number of photos per detected person |
| Match Rate | % of groups matched — your gallery’s “conversion rate” |
Top People
Section titled “Top People”A ranked list of attendees with the most photos. Typically includes:
- Keynote speakers (on stage in many photos)
- Event organizers (present throughout)
- VIP guests
- Networking-active attendees
Engagement Funnel
Section titled “Engagement Funnel”Tracks the attendee journey:
- Photos Uploaded → how many photos entered the system
- Faces Detected → how many faces the AI found
- Groups Created → how many unique people were identified
- Selfies Taken → how many attendees tried to find their photos
- Matches Found → how many successfully found their photos
- Downloads → how many photos were downloaded
- Social Shares → how many were shared externally
Each step shows a conversion rate, so you can identify where attendees drop off.
Recent Retrievers
Section titled “Recent Retrievers”A live feed of attendees who recently accessed their photos — shows names, timestamps, and number of photos retrieved.
Recent Contributors
Section titled “Recent Contributors”A live feed of attendees who recently uploaded community photos.
Referral Stats
Section titled “Referral Stats”How attendees discovered the gallery:
- Direct link — typed or bookmarked the URL
- Email — clicked from an email campaign
- WhatsApp — clicked from a WhatsApp campaign
- Event website — clicked from the event site
- Social media — clicked from a social post
Partner Spotlight ROI
Section titled “Partner Spotlight ROI”If you have sponsor ads in the gallery:
- Impressions per sponsor
- Click-through rates
- Unique viewers reached
Date Range Filtering
Section titled “Date Range Filtering”Filter all analytics by date range:
- Click the date range selector at the top of the dashboard.
- Choose a preset (Today, Last 7 Days, Last 30 Days) or set a custom range.
- All KPI cards and charts update to reflect the selected period.
This is useful for:
- Comparing Day 1 vs Day 2 engagement
- Measuring the impact of a marketing campaign (before/after sending the gallery link)
- Generating post-event reports for specific time periods
Exporting Analytics
Section titled “Exporting Analytics”Export the dashboard data for reports and presentations:
- Click the Export button on the dashboard.
- Choose the export format.
- Share with stakeholders, sponsors, and your marketing team.
Key Metrics to Track
Section titled “Key Metrics to Track”Here are the most important metrics to monitor and what actions to take:
| Metric | Target | Action If Low |
|---|---|---|
| Match Rate | > 50% | Send more gallery link reminders via email and WhatsApp |
| Downloads | Growing daily | Promote the gallery on social media and in follow-up emails |
| Social Shares | > 10% of downloads | Make sharing easier — add social share buttons prominently |
| Community Contributions | > 100 photos | Announce the upload feature during sessions and breaks |
| Engagement Funnel Drop-off | Identify the steepest drop | Fix the bottleneck — if selfie→match drops, check photo quality |
Best Practices
Section titled “Best Practices”- Check daily during events — monitor the dashboard each day to catch issues early (face processing stalled, low match rates, upload errors).
- Share stats with sponsors — Partner Spotlight ROI metrics are valuable proof of sponsorship value. Share them proactively.
- Post-event report — create a summary report within 1 week: total photos, unique people reached, downloads, shares. This is powerful marketing for your next event.
- Compare across events — track the same metrics for every event to identify trends. Are your galleries getting more engagement? Is the match rate improving?
- Act on the funnel — the engagement funnel is your most actionable metric. If people are being detected but not retrieving photos, your promotion is the problem — send more reminders.