Event Dashboard & KPIs
The Event Dashboard is the first thing you see when you open an event. It provides a real-time overview of registrations, attendance, revenue, and key performance indicators.
Dashboard Tabs
Section titled “Dashboard Tabs”The dashboard has two main tabs:
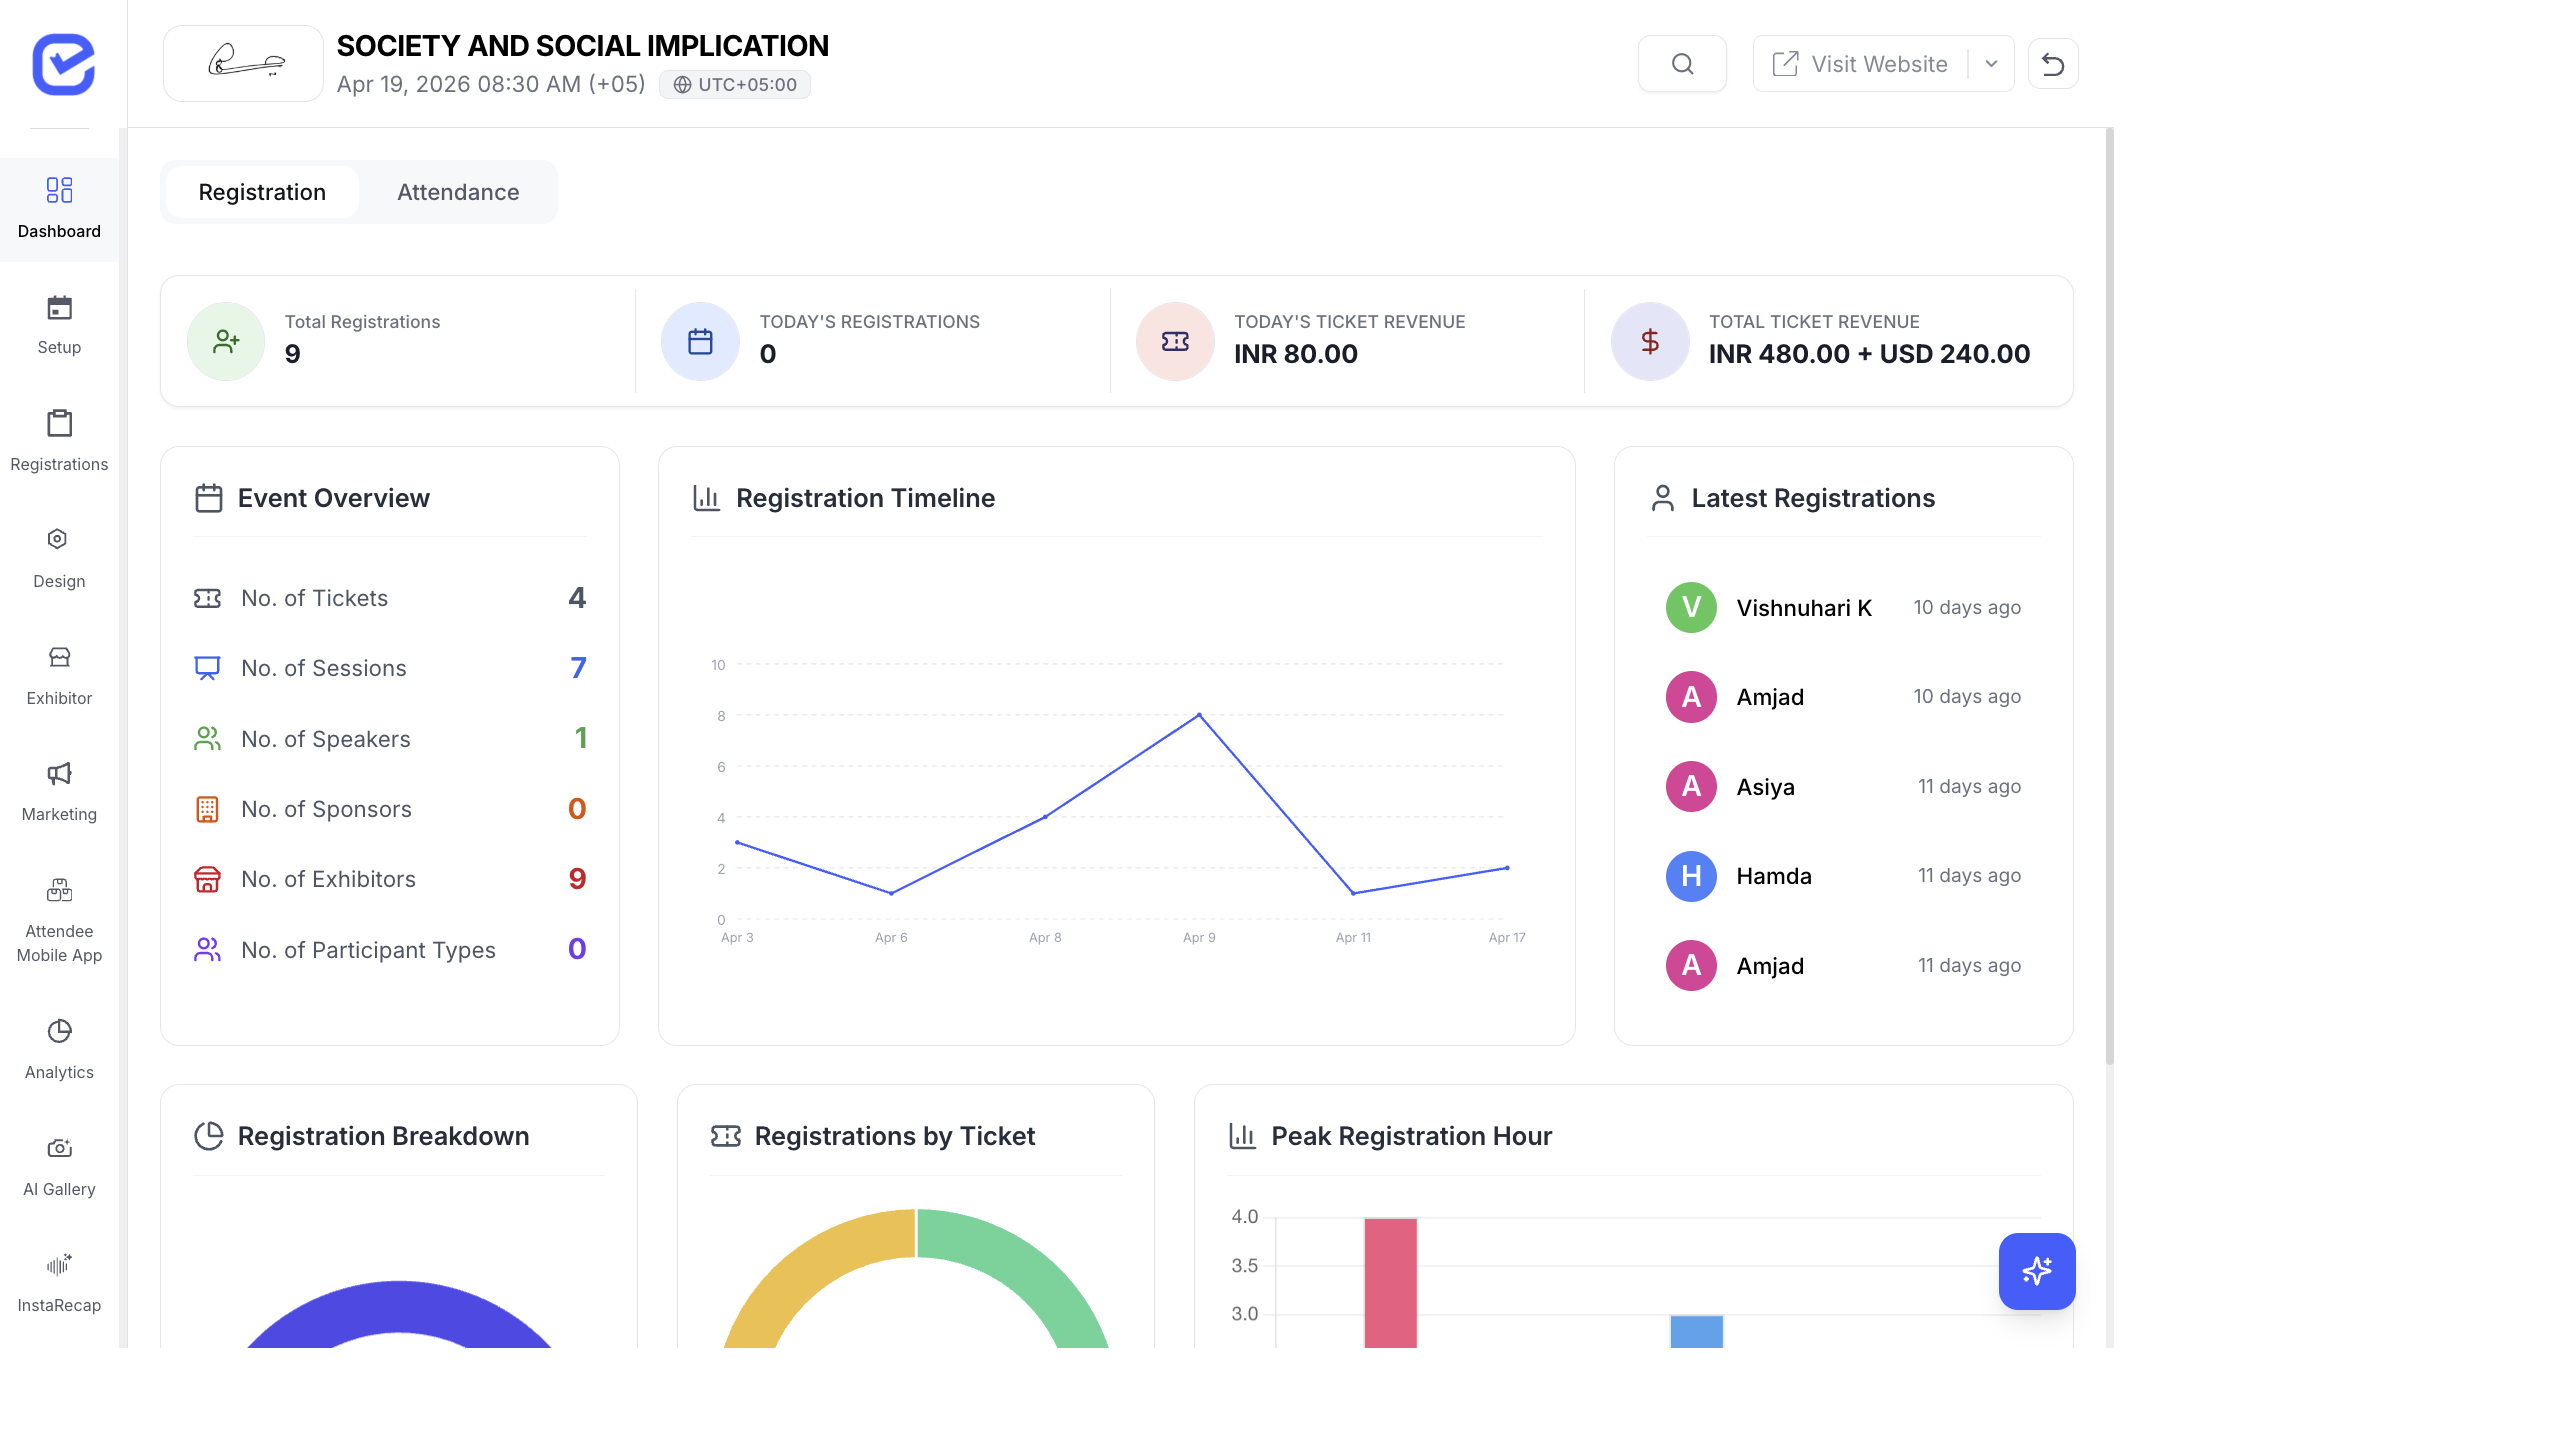
Registration Tab
Section titled “Registration Tab”Four key metrics at the top:
| KPI | What It Shows |
|---|---|
| Total Registrations | All-time registration count |
| Today’s Registrations | Registrations received today |
| Today’s Revenue | Revenue generated today |
| Total Revenue | All-time revenue from ticket sales |
Attendance Tab
Section titled “Attendance Tab”Four key metrics for event-day performance:
| KPI | What It Shows |
|---|---|
| Registered | Total registered attendees |
| Checked-In | Attendees who have checked in |
| Pending | Registered but not yet checked in |
| Check-In Rate | Percentage of registered attendees who checked in |
Charts & Visualizations
Section titled “Charts & Visualizations”Registration Charts
Section titled “Registration Charts”- Registration Timeline — line chart showing registrations over time. Spot when your marketing campaigns drive spikes.
- Registration Breakdown — first-time attendees vs. returning attendees.
- Registrations by Ticket — bar chart showing which ticket types are most popular.
- Peak Hour Analysis — which hours of the day get the most registrations.
Attendance Charts
Section titled “Attendance Charts”- Check-In Timeline — line chart of check-ins over time on event day.
- Check-In Rate by Ticket — which ticket types have the highest and lowest show-up rates.
Event Overview
Section titled “Event Overview”Below the charts, the dashboard shows:
| Metric | Description |
|---|---|
| Tickets | Number of ticket types created |
| Sessions | Total sessions scheduled |
| Speakers | Confirmed speakers |
| Sponsors | Active sponsors |
| Exhibitors | Registered exhibitors |
Recent Registrations
Section titled “Recent Registrations”A live feed of the latest registrations with attendee name, ticket type, and timestamp.
Using Dashboard Data
Section titled “Using Dashboard Data”Identify Marketing Impact
Section titled “Identify Marketing Impact”Watch the Registration Timeline chart during marketing campaigns. If you launch a social media campaign on Monday and see a registration spike on Tuesday, you know the campaign is working.
Optimize Check-In
Section titled “Optimize Check-In”On event day, use the Attendance tab to monitor check-in progress:
- If check-in rate is low 30 minutes before the first session, send a push notification reminder
- If one ticket type has much lower check-in rates, those attendees may need additional support
Revenue Tracking
Section titled “Revenue Tracking”The revenue KPIs update in real-time as payments are processed. Use this to:
- Track daily revenue targets
- Compare revenue across ticket types
- Monitor the impact of discount codes on total revenue
Best Practices
Section titled “Best Practices”- Check the dashboard daily during the registration period — catch issues early (low registration velocity, payment failures).
- Screenshot the dashboard for your post-event report. The charts provide ready-made visuals for stakeholder presentations.
- Compare with targets — set registration and revenue targets before launch, then track progress on the dashboard daily.
- Use Peak Hour data — if most registrations come at 9 PM, schedule your marketing emails and social posts for 8 PM.