Organization Dashboard
The Organization Dashboard gives you a bird’s-eye view across all your events — total attendees, revenue, team members, and your EventHex subscription.
Access the Organization Dashboard
Section titled “Access the Organization Dashboard”Click your organization name in the top navigation or go to the organization settings page.
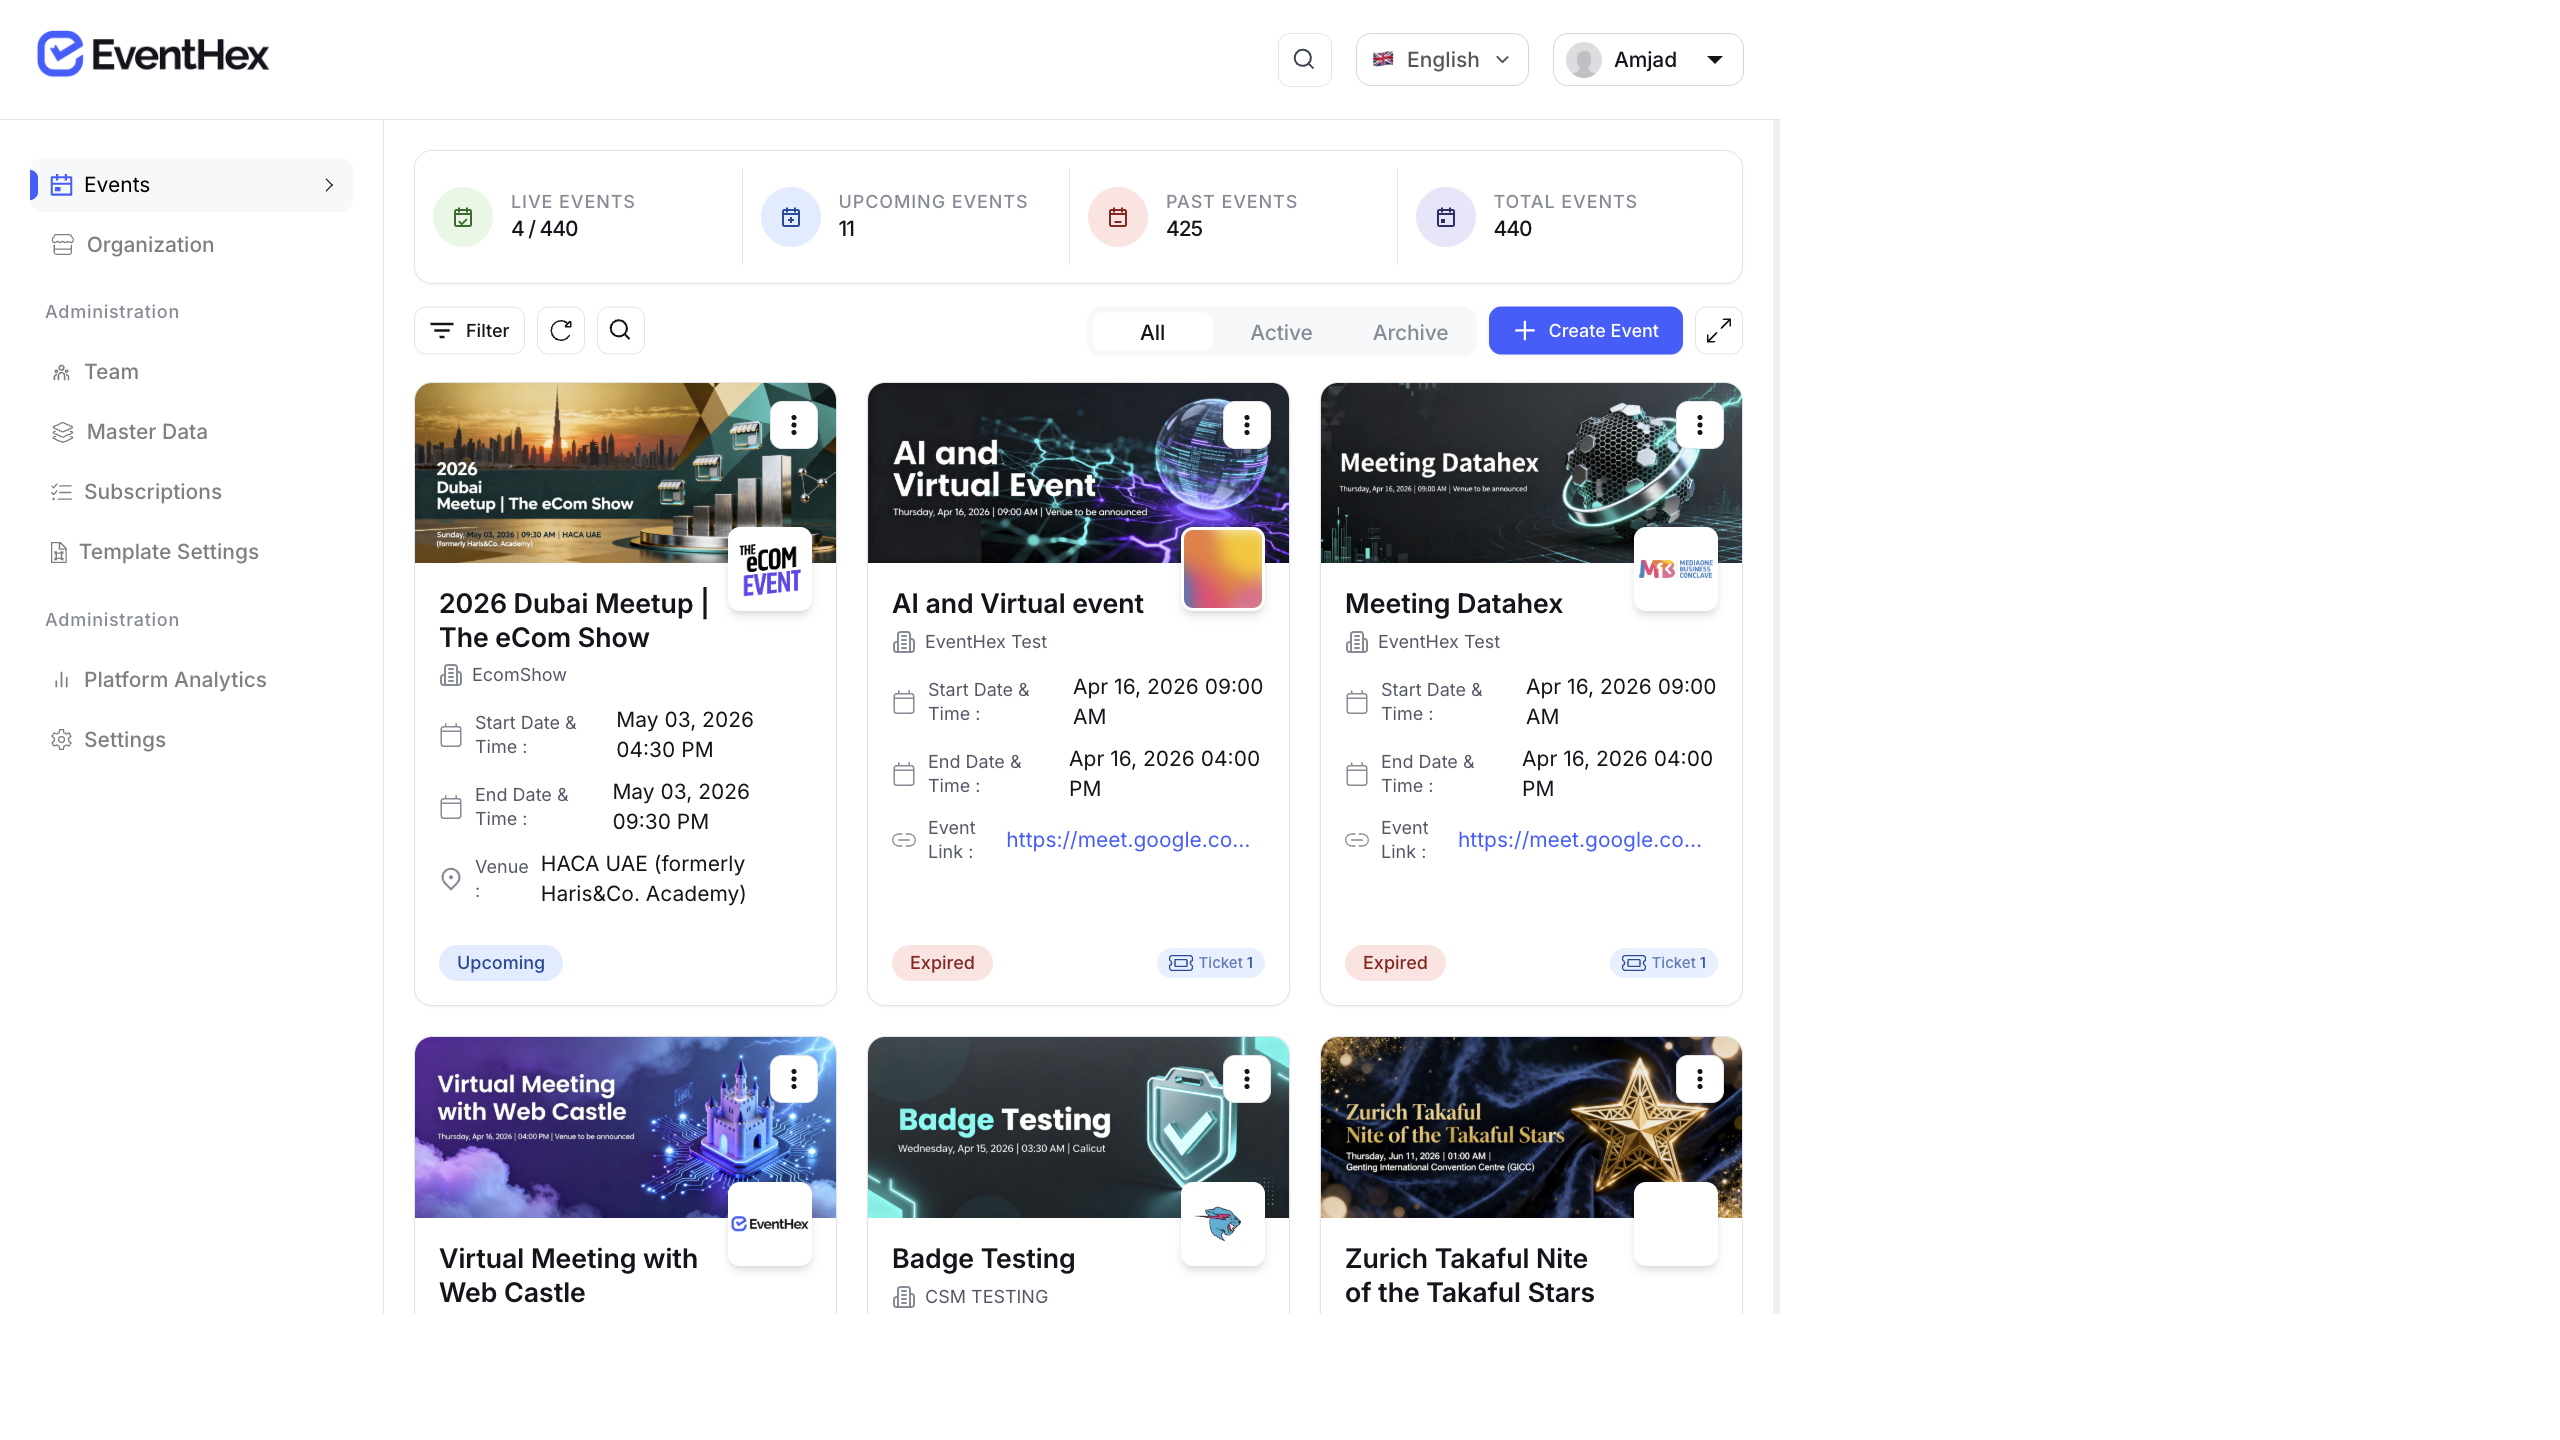
Key Metrics
Section titled “Key Metrics”| KPI | Description |
|---|---|
| Total Events | Number of events created under this organization |
| Total Attendees | Combined attendees across all events |
| Total Revenue | Combined revenue across all events |
| Active Team | Number of team members with active access |
Organization Sections
Section titled “Organization Sections”Recent Events
Section titled “Recent Events”A list of your most recent events with:
- Event name and date
- Registration count
- Quick access to the event dashboard
Team Members
Section titled “Team Members”Grid view of all team members with:
- Name and role
- Permissions level
- Last active date
Manage team members here — add new members, update roles, or revoke access.
Subscription Info
Section titled “Subscription Info”Your current EventHex plan details:
- Plan name and tier
- Features included
- Usage vs. limits
- Renewal date
Analytics Hub
Section titled “Analytics Hub”The organization-level Analytics Hub provides cross-event analytics with tabs:
| Tab | Data |
|---|---|
| Registration | Registration trends across events, ticket type distribution, growth over time |
| Attendance | Check-in rates across events, average show-up rates |
| AI Photo Gallery | Photo uploads and engagement across events |
| InstaRecap | Recap usage and engagement (shown only if InstaRecap is enabled) |
Multi-Currency Support
Section titled “Multi-Currency Support”Revenue is displayed in your organization’s default currency. EventHex auto-detects currency based on your payment provider configuration. If you run events in multiple currencies, revenue is shown per-currency.
Best Practices
Section titled “Best Practices”- Review the org dashboard monthly — track growth trends across events. Are you getting more attendees per event? Is revenue growing?
- Monitor team access — remove team members who no longer need access. Regularly audit who has admin vs. editor permissions.
- Compare events — use the Analytics Hub to compare registration and attendance across events. Identify what worked in your best-performing events and replicate it.